Visual place recognition (VPR) enables autonomous robots to identify previously visited locations, which contributes to tasks like simultaneous localization and mapping (SLAM). VPR faces challenges such as accurate image neighbor retrieval and appearance change in scenery.
Event cameras, also known as dynamic vision sensors, are a new sensor modality for VPR and offer a promising solution to the challenges with their unique attributes: high temporal resolution (1MHz clock), ultra-low latency (in μs), and high dynamic range (>120dB). These attributes make event cameras less susceptible to motion blur and more robust in variable lighting conditions, making them suitable for addressing VPR challenges. However, the scarcity of event-based VPR datasets, partly due to the novelty and cost of event cameras, hampers their adoption.
To fill this data gap, our paper introduces the NYC-Event-VPR dataset to the robotics and computer vision communities, featuring the Prophesee IMX636 HD event sensor (1280x720 resolution), combined with RGB camera and GPS module. It encompasses over 13 hours of geotagged event data, spanning 260+ kilometers across New York City, covering diverse lighting and weather conditions, day/night scenarios, and multiple visits to various locations.
Furthermore, our paper employs three frameworks to conduct generalization performance assessments, promoting innovation in event-based VPR and its integration into robotics applications.
| Duration (hr) | Data size (GB) | Modality | Distance (km) | Weather | Lighting conditions | Resolution (px) |
|---|---|---|---|---|---|---|
| 13.5 | 466.7 | event, RGB, GPS | 259.95 | rainy, cloudy, sunny | day, night | 1280 x 720 |
NYC-Event-VPR dataset statistics.
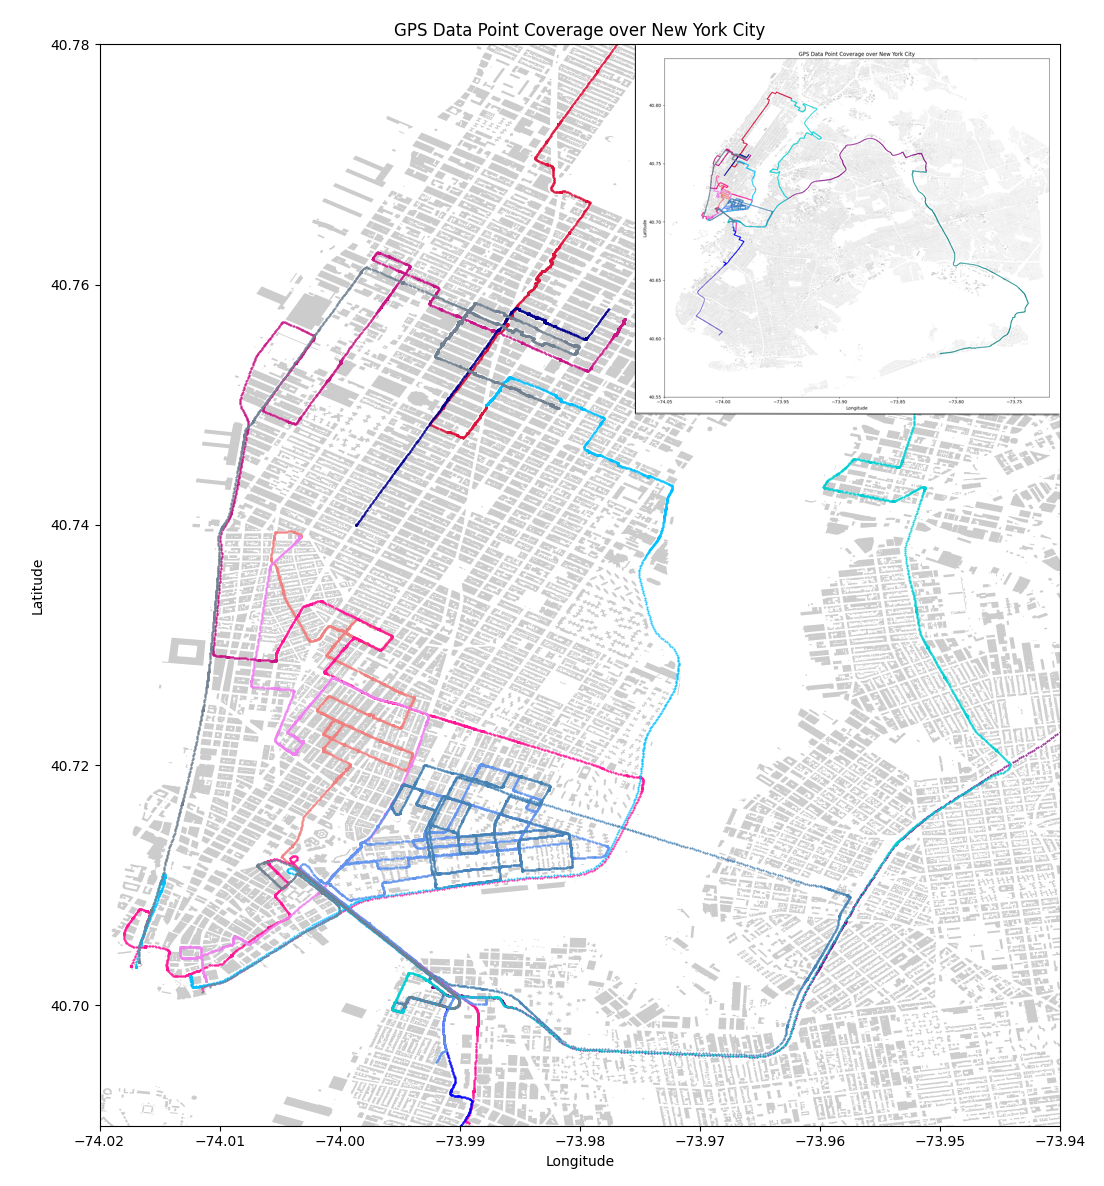
NYC-Event-VPR covers New York City, focusing on Chinatown area in Manhattan with overlapping traversal.
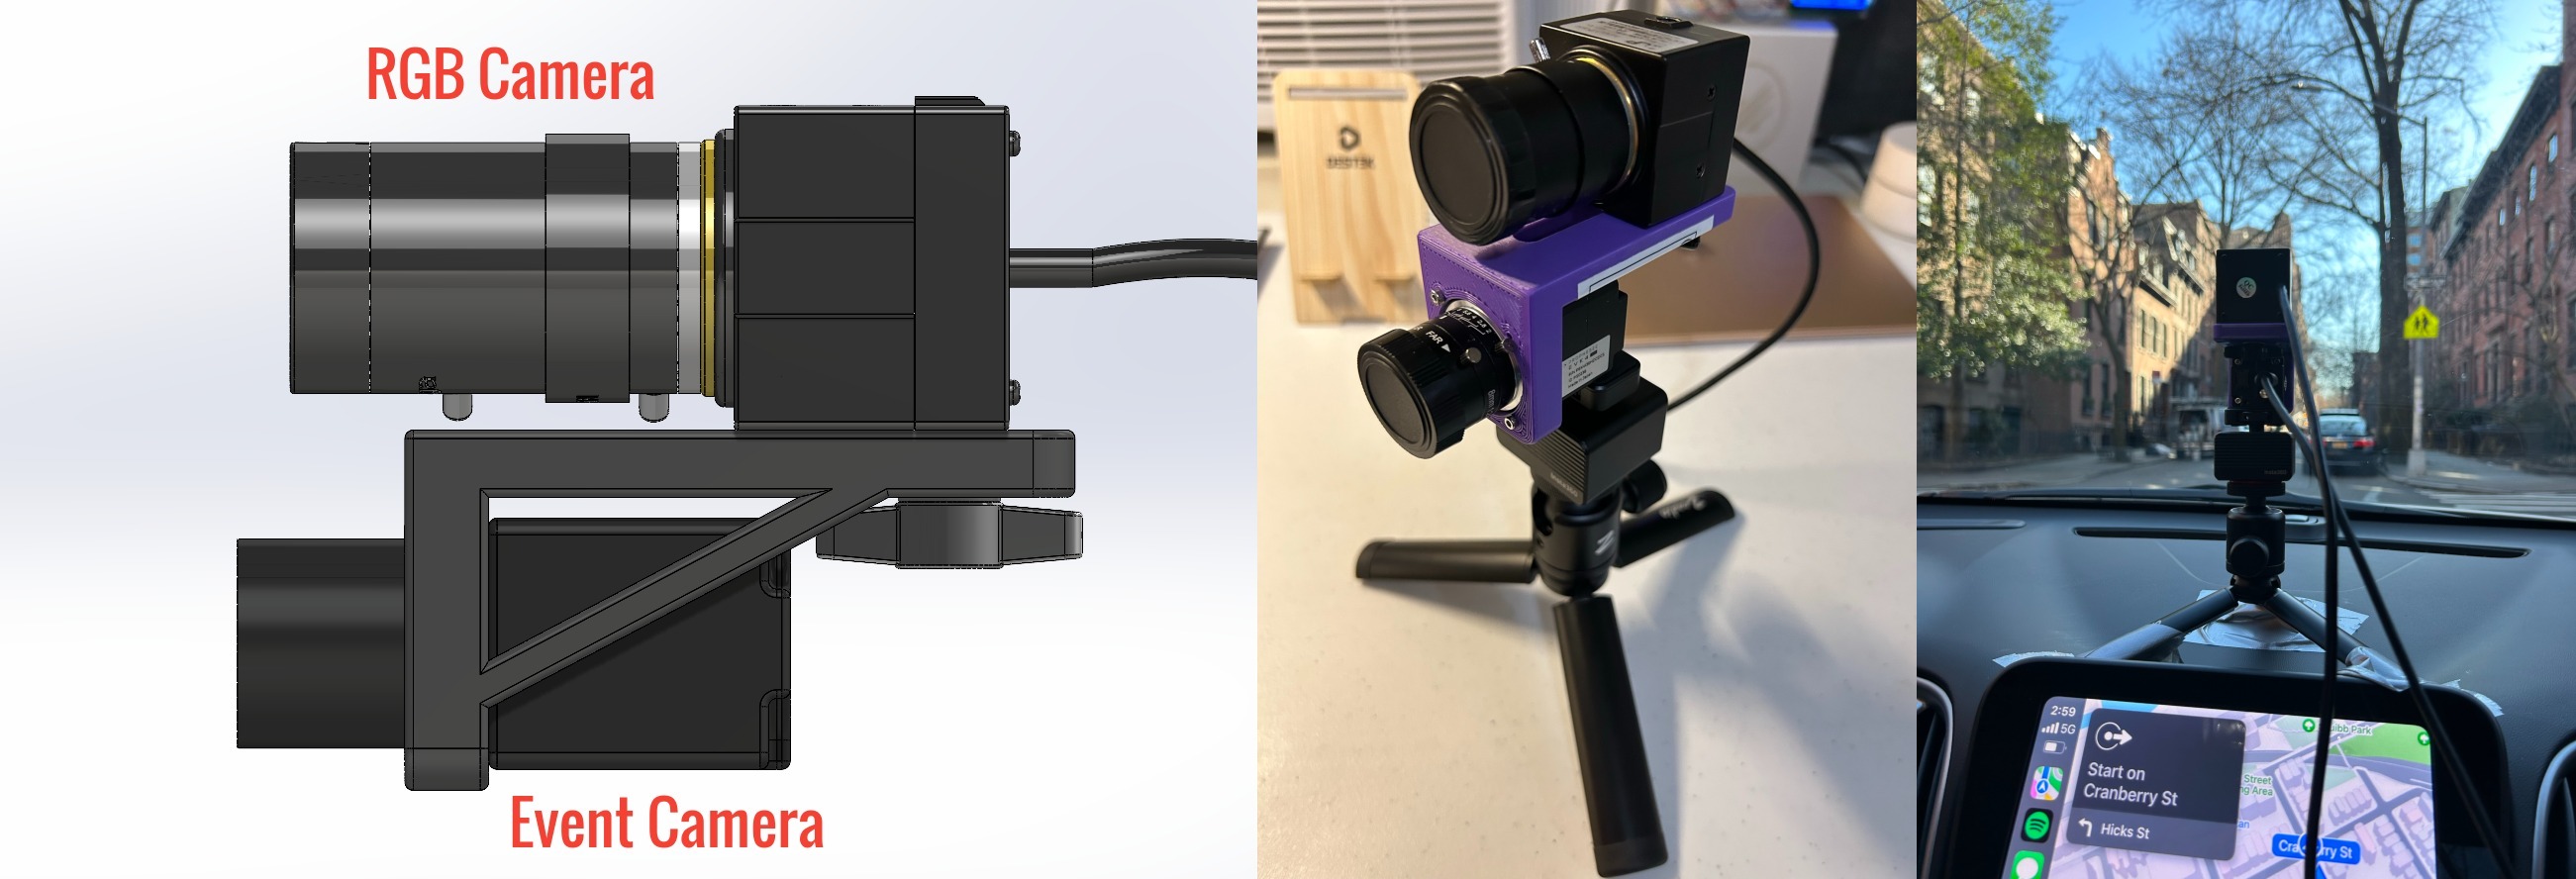
Sensor setup and mounting design: RGB camera is mounted on top of event camera, and the sensor suite is positioned facing forward behind vehicle`s front windshield.
| Type | Specification |
|---|---|
| Prophesee EV4 HD |
                IMX636ES (HD) event vision sensor,
                Resolution (px): 1280x720,
                Latency (µs): 220,
                Dynamic range (dB): >86,
                Power consumption: 500mW-1.5W,
                Pixel size (µm): 4.86x4.86,
                Camera max bandwidth (Gbps): 1.6,
                Interface: USB 3.0
|
| ELP USB Camera |
                CMOS 1080p sensor,
                Resolution (px): 1280x720,
                Interface: USB 2.0,
                5-50mm varifocal lens
|
| Sparkfun GPS-RTK-SMA |
                Horizontal accuracy: 2.5m w/o RTK,
                Max altitude: 50km,
                Max velocity: 500m/s,
                GPS, GLONASS, Galileo, BeiDou
|
Sensor specifications.
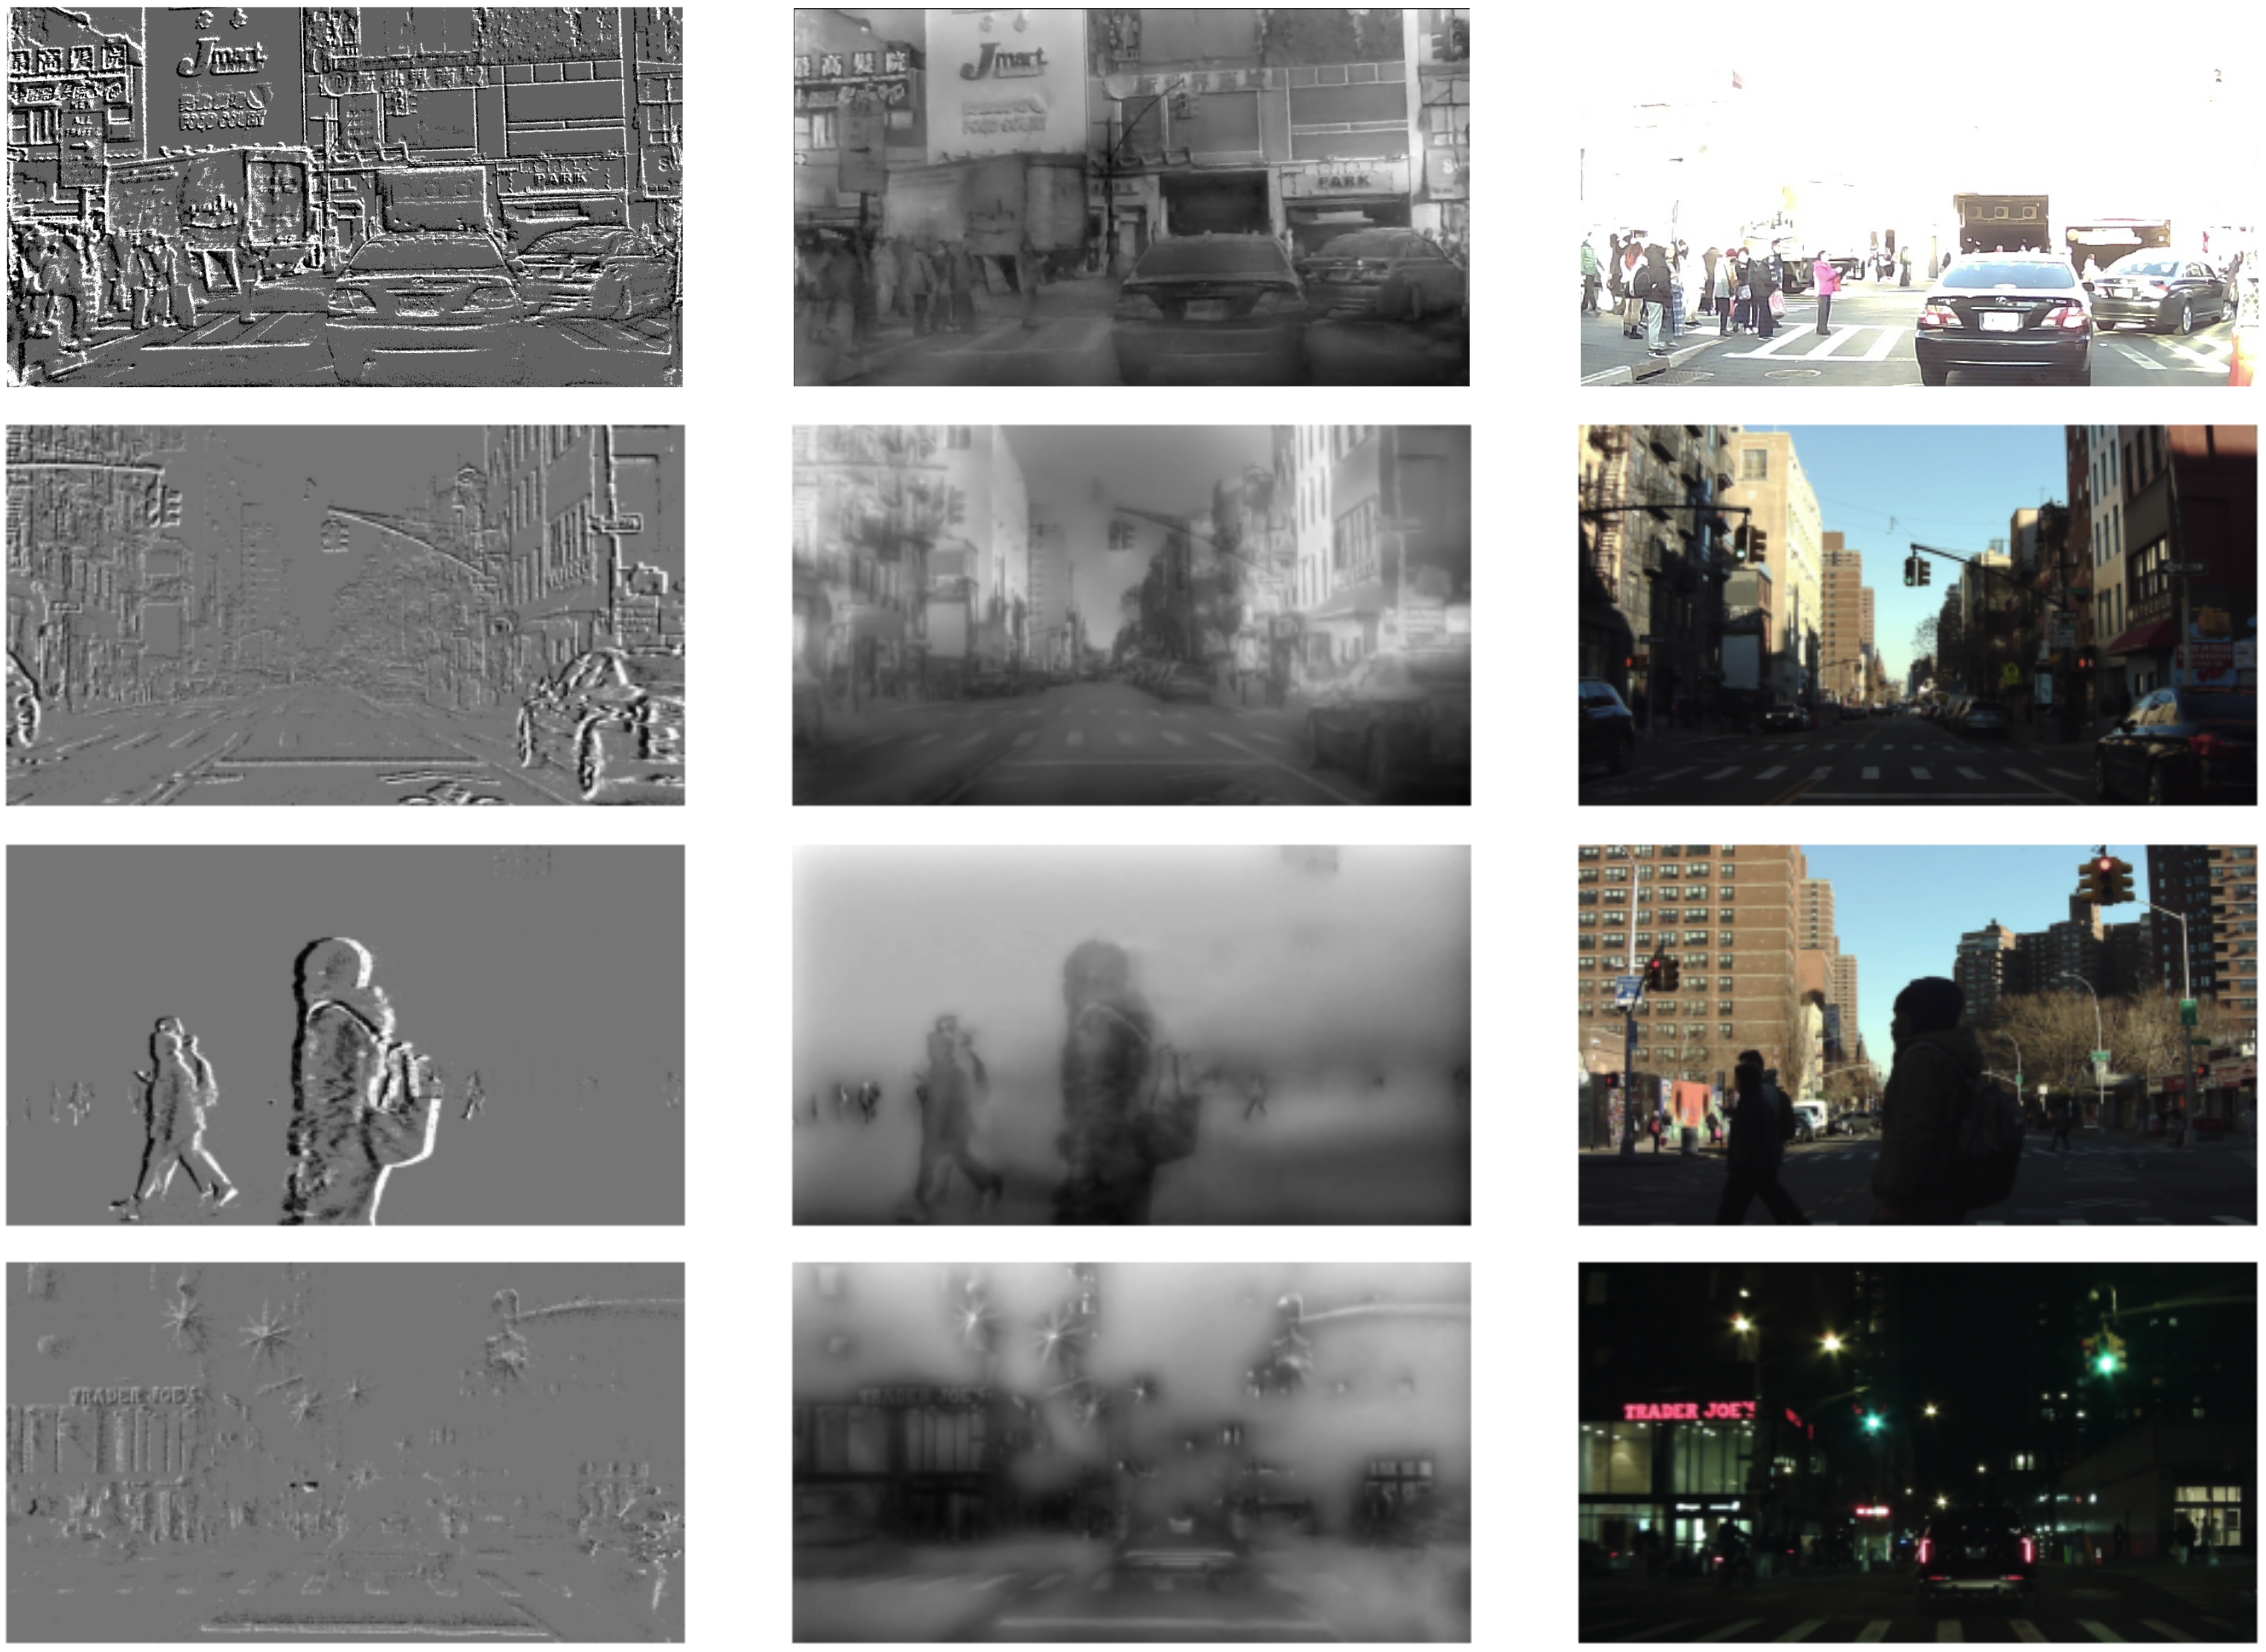
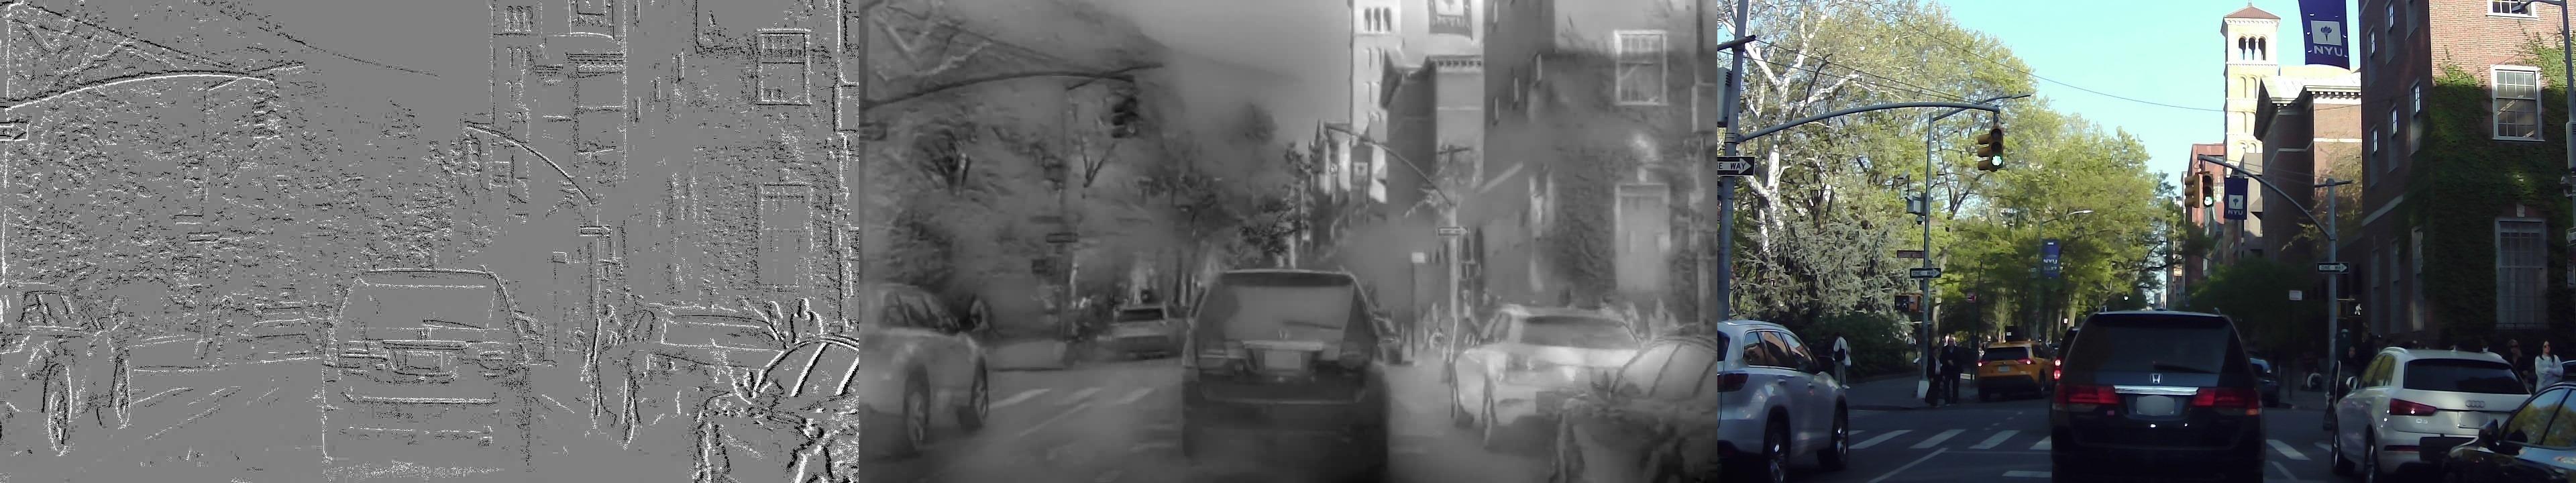
Example images in processed dataset (from left to right columns): naive conversion, E2VID reconstruction, RGB reference. Each row is the same visual scene. Each column is the same dataset.
| Datasets | NetVLAD | RegionVLAD | HOG | AMOSNet | HybridNet | CALC |
|---|---|---|---|---|---|---|
| NYC-Event-VPR-Naive-5m | 34.24 | 26.41 | 25.31 | 67.62 | 69.65 | 74.78 |
| NYC-Event-VPR-Naive-15m | 40.53 | 29.84 | 32.14 | 73.09 | 75.09 | 81.55 |
| NYC-Event-VPR-Naive-25m | 40.52 | 31.15 | 32.75 | 73.25 | 74.66 | 80.76 |
| NYC-Event-VPR-E2VID-5m | 74.06 | 77.56 | 86.03 | 86.22 | 85.51 | 84.69 |
| NYC-Event-VPR-E2VID-15m | 84.92 | 89.15 | 95.89 | 97.16 | 96.87 | 96.09 |
| NYC-Event-VPR-E2VID-25m | 87.01 | 89.64 | 98.88 | 99.53 | 99.45 | 99.27 |
| NYC-Event-VPR-RGB-5m | 92.52 | 92.58 | 92.43 | 94.52 | 94.33 | 92.86 |
| NYC-Event-VPR-RGB-15m | 98.14 | 97.12 | 95.20 | 98.26 | 98.26 | 96.85 |
| NYC-Event-VPR-RGB-25m | 98.63 | 97.88 | 95.94 | 99.31 | 99.29 | 97.95 |
| Pittsburgh250K | 94.36 | 73.34 | 0.27 | 8.53 | 8.70 | 2.05 |
| Nordland | 8.49 | 13.33 | 2.89 | 30.13 | 17.52 | 12.91 |
Quantitative results of Area Under the Curve- Precision Recall (AUC-PR) in percentage.
Top 9 datasets are from NYC-Event-VPR. Each row represents a set of 6 benchmark tests on that dataset. Bottom 2 datasets are curated subsets of their respective datasets provided by VPR-Bench. All tests are done using pretrained weights provided by VPR-Bench.
| CCT384+NetVLAD | Naive-5m | E2VID-5m | RGB-5m | Naive-15m | E2VID-15m | RGB-15m | Naive-25m | E2VID-25m | RGB-25m |
|---|---|---|---|---|---|---|---|---|---|
| Recall@1 | 33.2 | 48.7 | 57.7 | 51 | 70.5 | 77.8 | 57.3 | 77.9 | 86 |
| Recall@5 | 45.1 | 54.4 | 61.3 | 64 | 78.2 | 81.4 | 74.1 | 85.4 | 90.1 |
| Recall@10 | 48.7 | 55.8 | 62.4 | 68.6 | 80.3 | 82.4 | 79.5 | 87.1 | 91 |
| Recall@20 | 51.2 | 57.1 | 63.2 | 73.2 | 81.7 | 83.1 | 83.9 | 88.7 | 91.7 |

| ResNet50+NetVLAD | Naive-5m | E2VID-5m | RGB-5m | Naive-15m | E2VID-15m | RGB-15m | Naive-25m | E2VID-25m | RGB-25m |
|---|---|---|---|---|---|---|---|---|---|
| Recall@1 | 39.1 | 51.9 | 59.1 | 54.9 | 73.1 | 79 | 62.3 | 80.5 | 86.9 |
| Recall@5 | 48.9 | 54.7 | 62.2 | 68.6 | 78.4 | 82.4 | 76.4 | 85.8 | 91 |
| Recall@10 | 51.5 | 55.6 | 62.5 | 72.6 | 79.8 | 83.1 | 80.7 | 87.5 | 91.5 |
| Recall@20 | 53.1 | 56.2 | 62.8 | 75.8 | 80.9 | 83.5 | 83.7 | 89 | 92 |
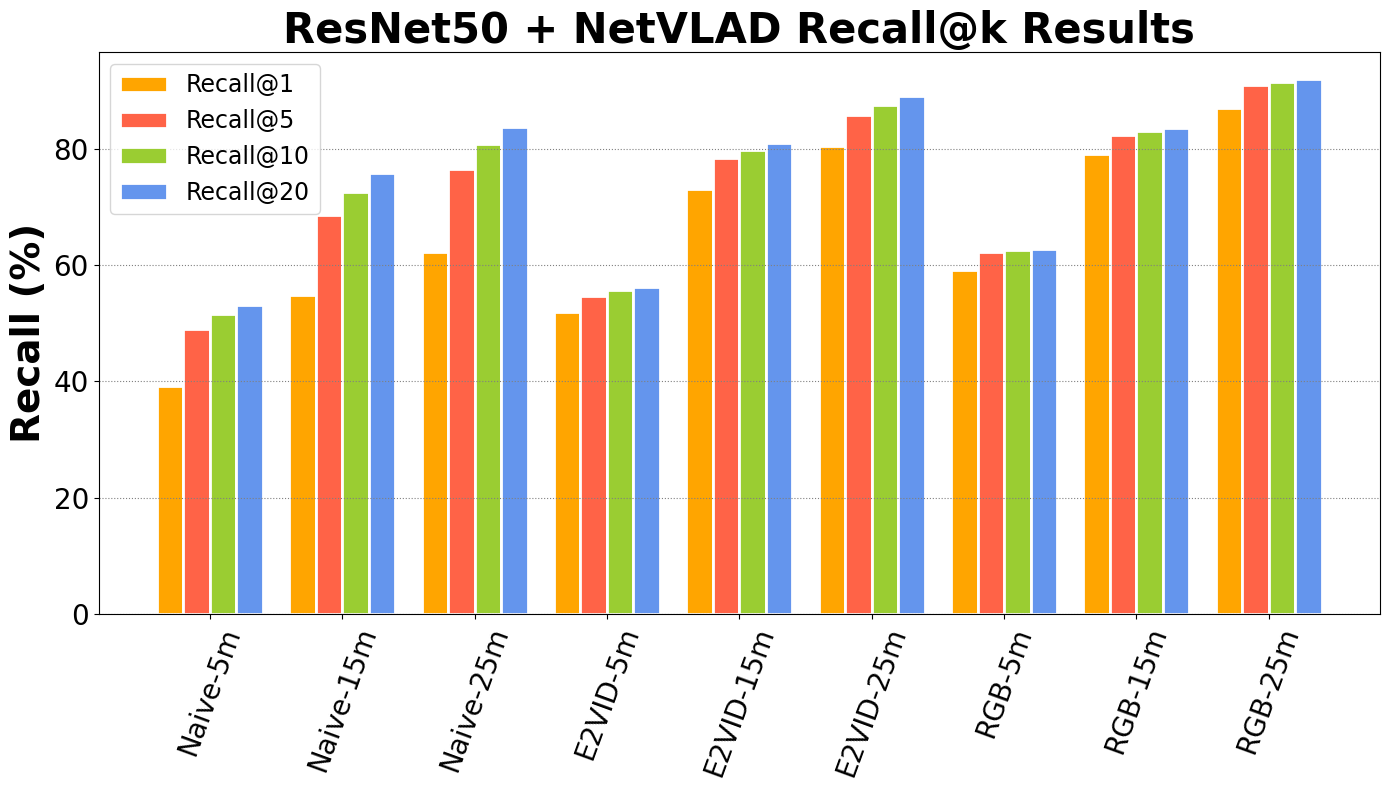
Quantitative results of recall@k in percentage.
First table is test results of deep learning model trained on NYC-Event-VPR. Backbone is CCT384 (Compact Convolutional Transformer). Aggregation is done via NetVLAD.
Second table is also test results of deep learning model trained on NYC-Event-VPR. Backbone is ResNet50 (Residual Network). Aggregation is done via NetVLAD.
All benchmarks are done by training the model on NYC-Event-VPR dataset using Deep Visual Geo-localization Benchmark framework.
| ResNet50+NetVLAD | Naive-5m | E2VID-5m | RGB-5m | Naive-15m | E2VID-15m | RGB-15m | Naive-25m | E2VID-25m | RGB-25m |
|---|---|---|---|---|---|---|---|---|---|
| Recall@1 | 29.6 | 43.7 | 59.4 | 45.8 | 63.5 | 79.5 | 51.5 | 69.4 | 87.9 |
| Recall@5 | 40.9 | 50.5 | 62.6 | 60.4 | 72.1 | 82.7 | 67.1 | 79.4 | 91.3 |
| Recall@10 | 43.6 | 52.2 | 63.1 | 64.6 | 74.5 | 83.0 | 71.6 | 82.0 | 92.0 |
| Recall@20 | 46.9 | 53.7 | 63.3 | 68.7 | 76.5 | 83.4 | 76.1 | 83.9 | 92.5 |
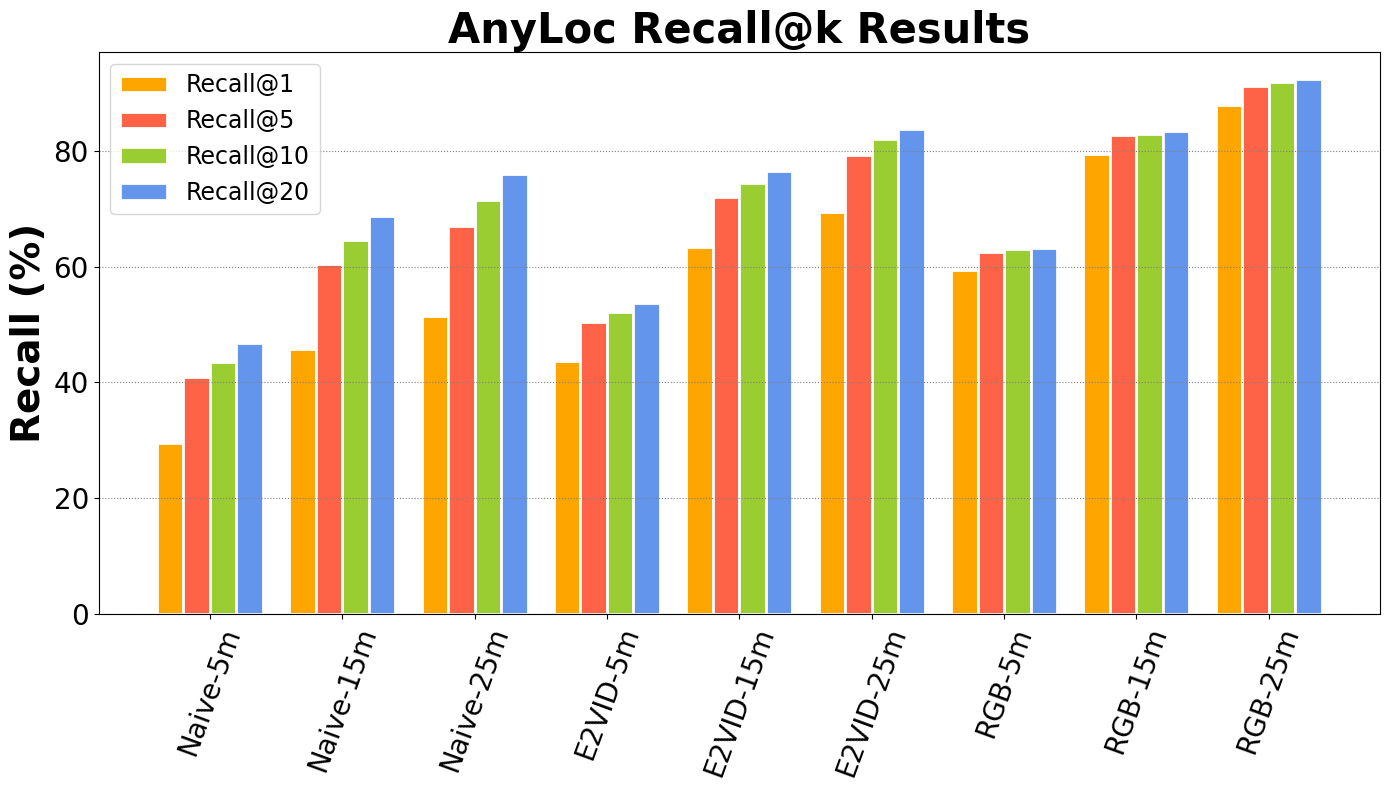
Quantitative results of recall@k in percentage.
All benchmarks are done by evaluating the model with AnyLoc (backbone: DINOv2) on NYC-Event-VPR dataset.
All benchmarks are done by evaluating the model on NYC-Event-VPR dataset using VPR Methods Evaluation framework.