NYU-VPR Dataset Website

This is the official website for paper NYU-VPR

Introduction


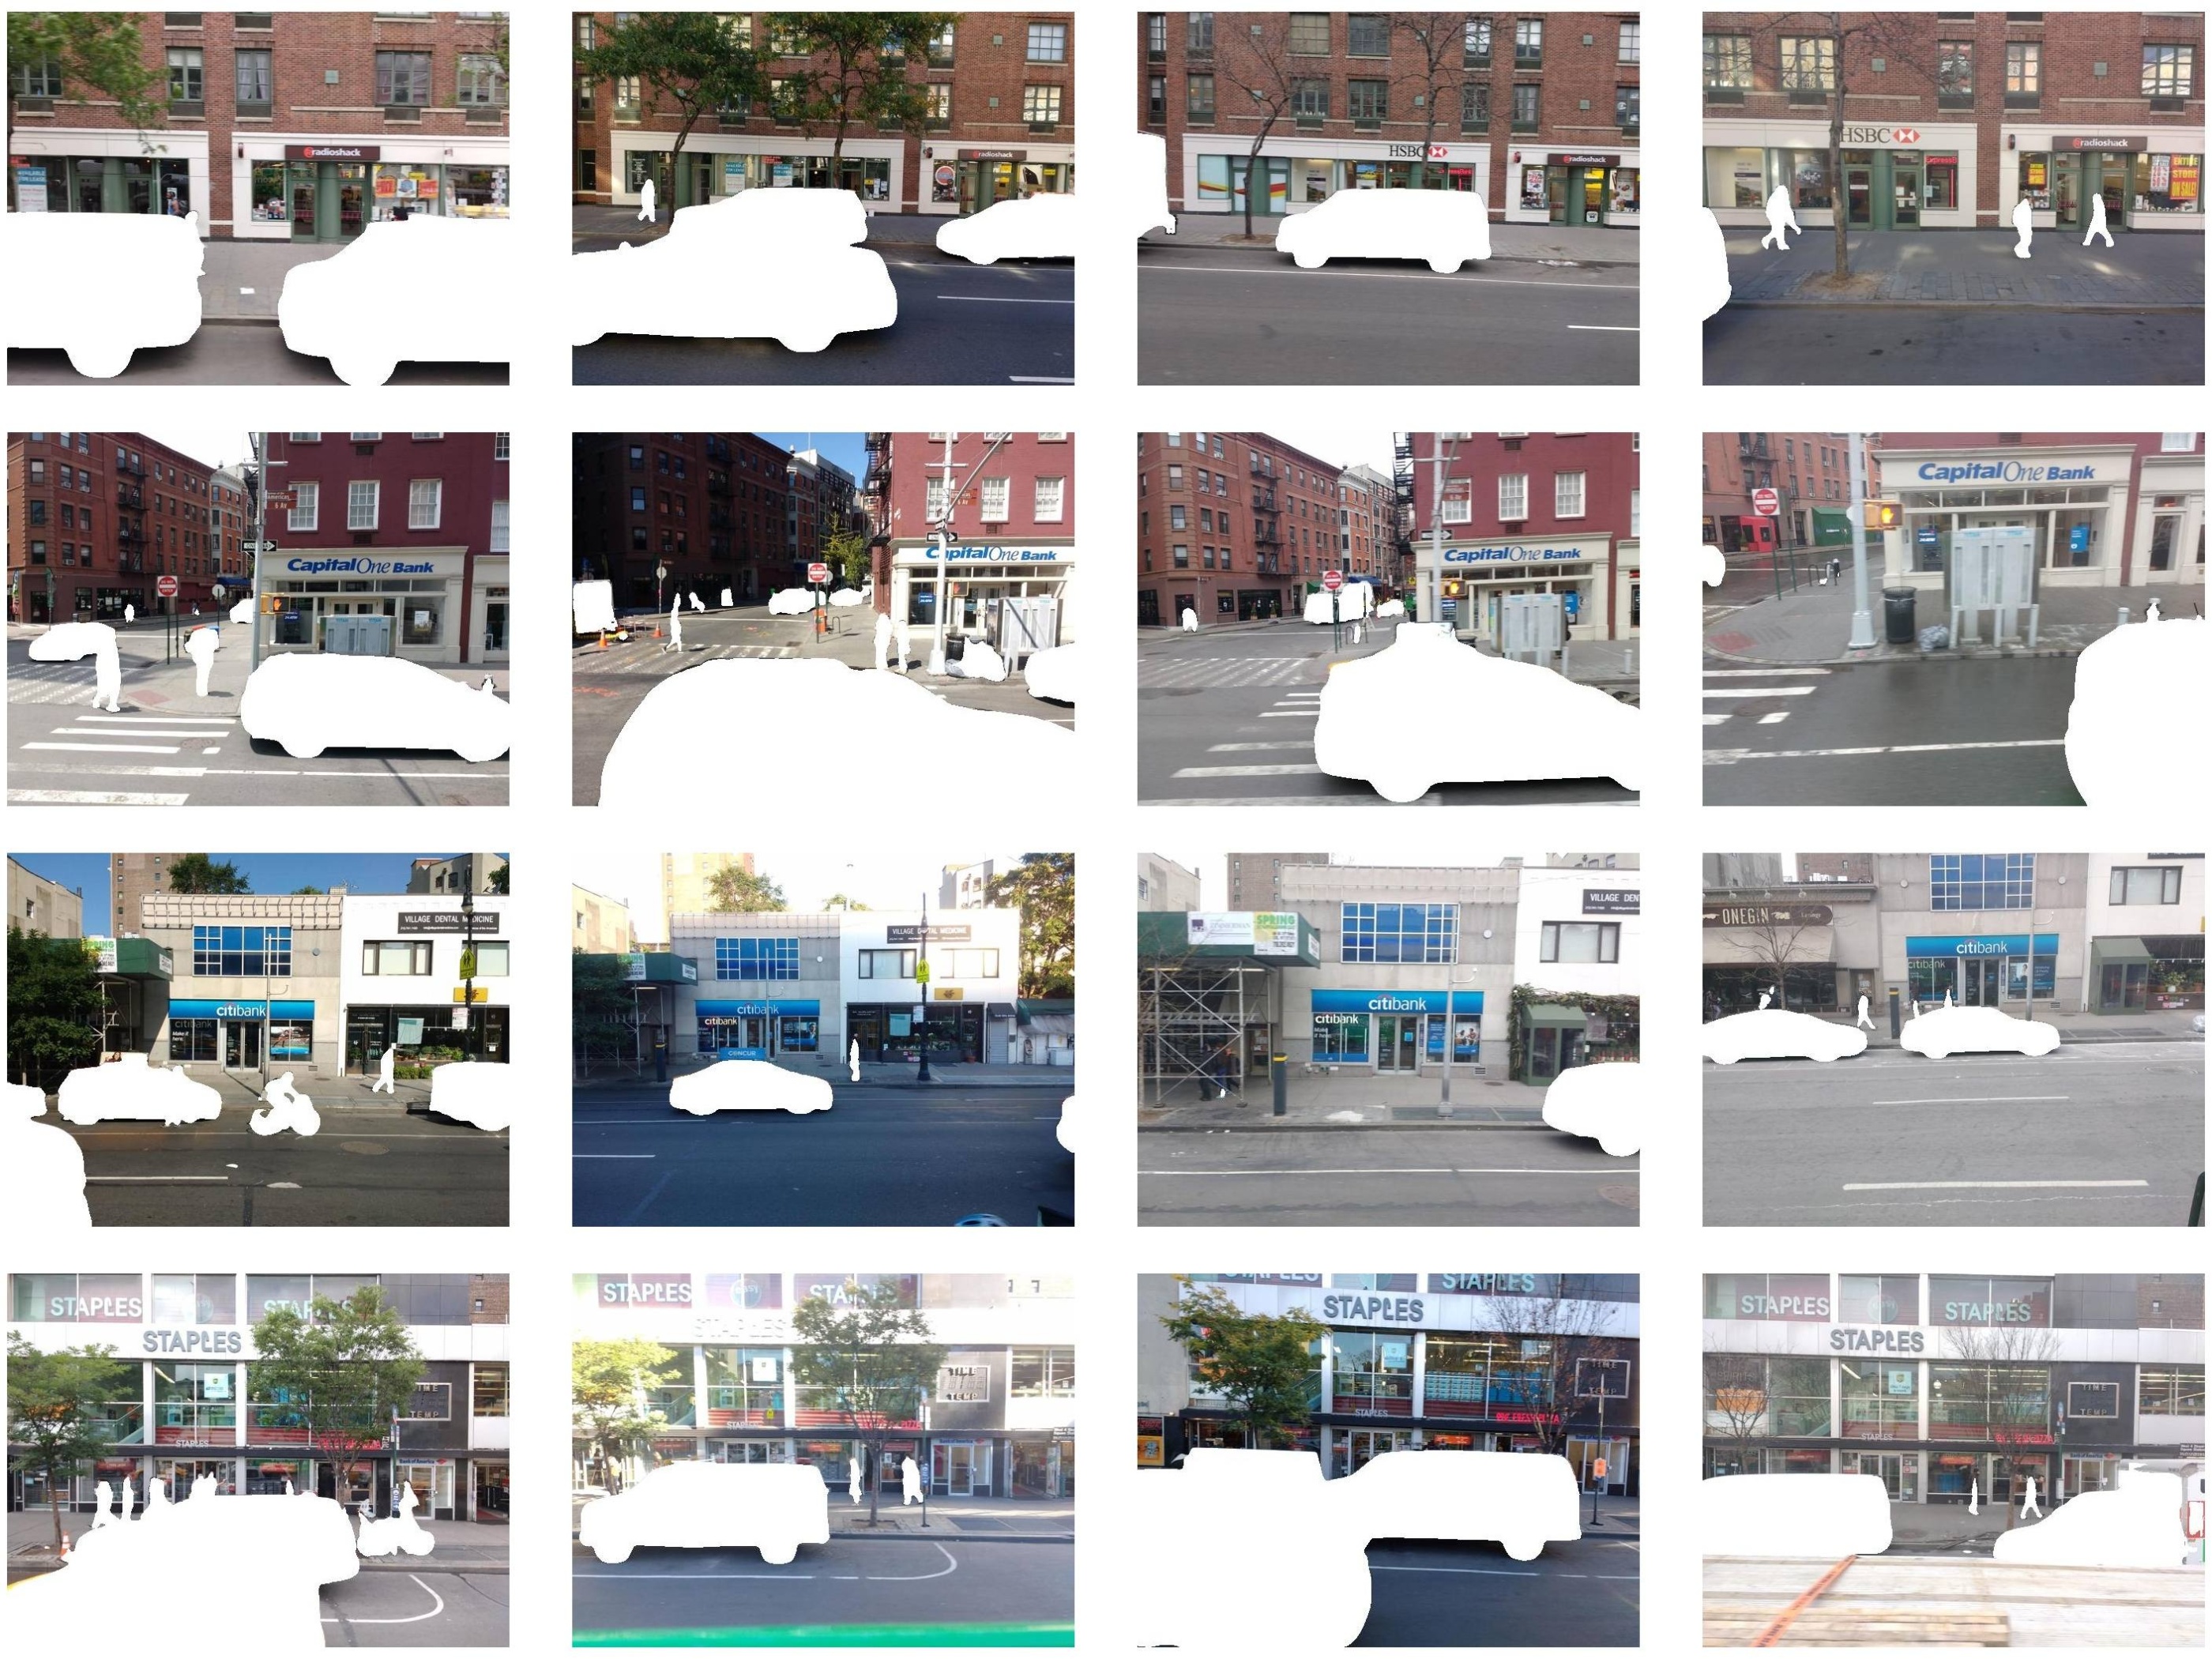
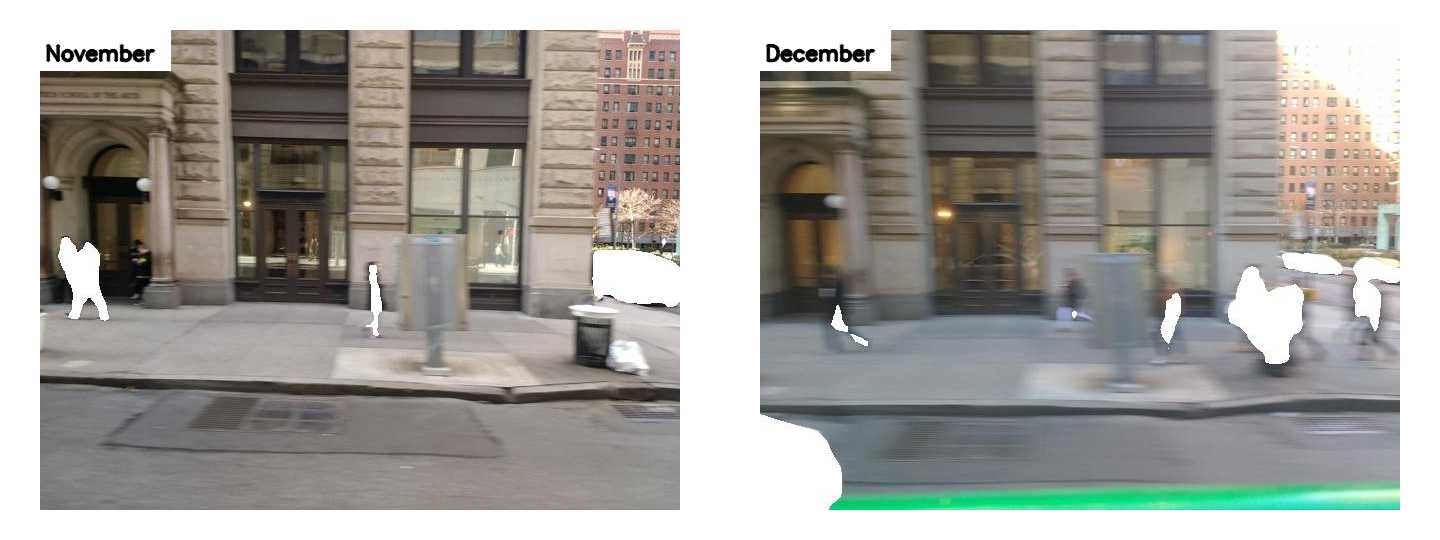
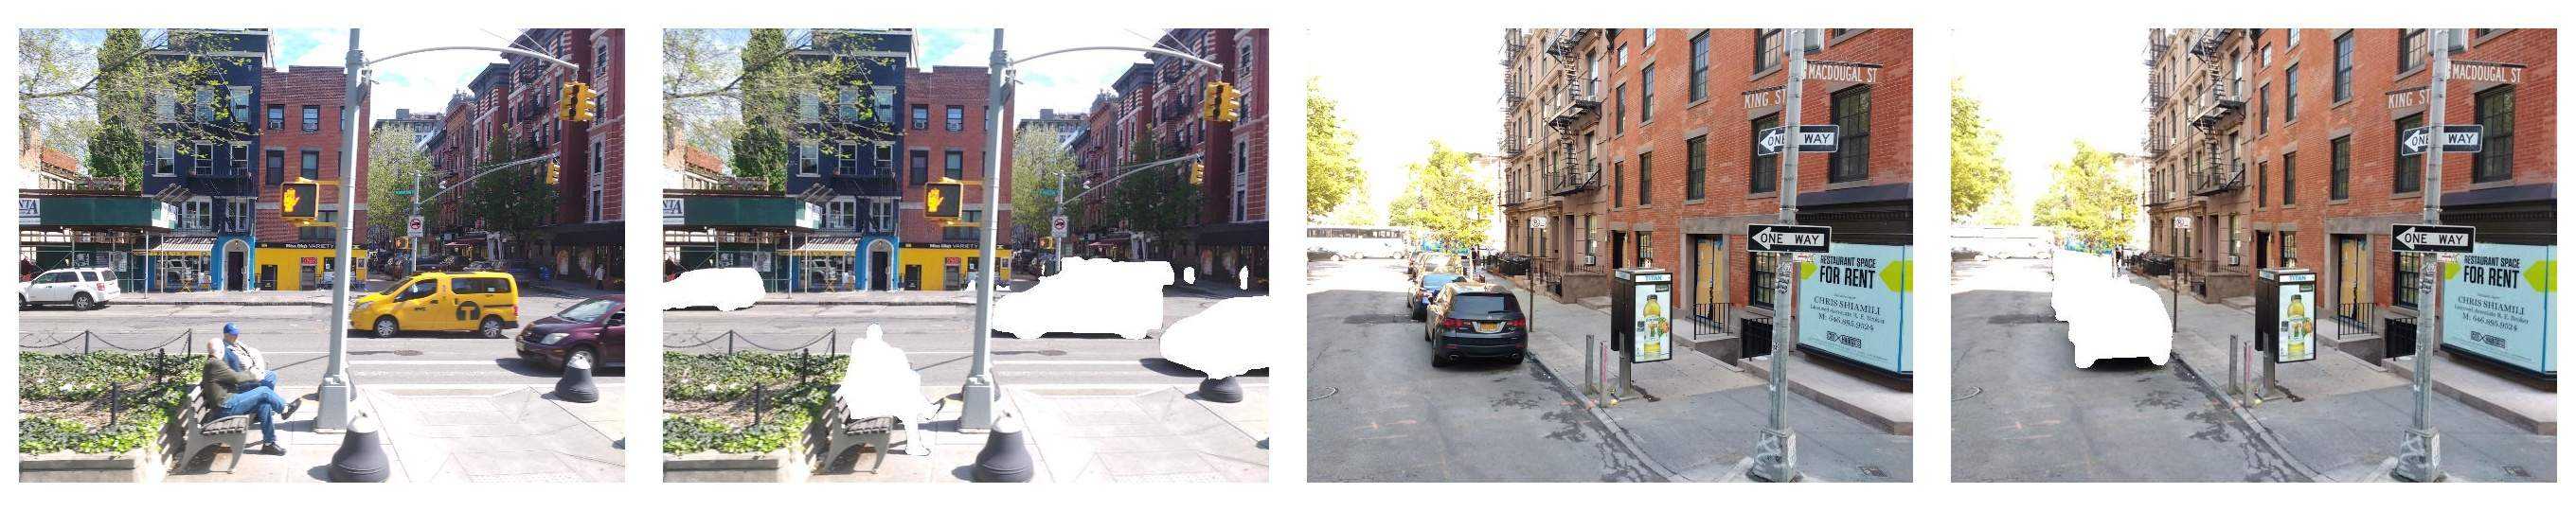
Our dataset is named NYU-VPR. It is composed of images recorded in Manhattan, New York from April 2016 to March 2017. The images were recorded by cameras installed on the front, back, and side parts of taxis with auto-exposure. The dataset contains both side-view images and front-view images. There are 100,500 side-view and 101,290 front-view images, each with a 640x480 resolution. On the basis of raw images, we use MSeg, a semantic segmentation method, to replace moving objects such as people and cars with white pixels. Fig. 1 compares anonymized and raw images.

non_anony
Fig. 1 - Illustration of raw images and anonymized images

The images were recorded on streets around Washington Square Park. The trajectories of the locations where the images were recorded are shown in Fig. 2. Since the cameras were placed on fleet cars, and their routes were random, the frequencies of locations where the images were taken are different. The frequencies of the locations where the side-view and front-view images were recorded are shown in Fig. 3 and Fig. 4 respectively.

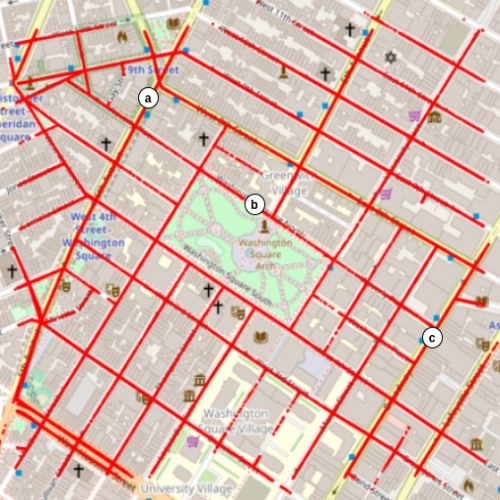
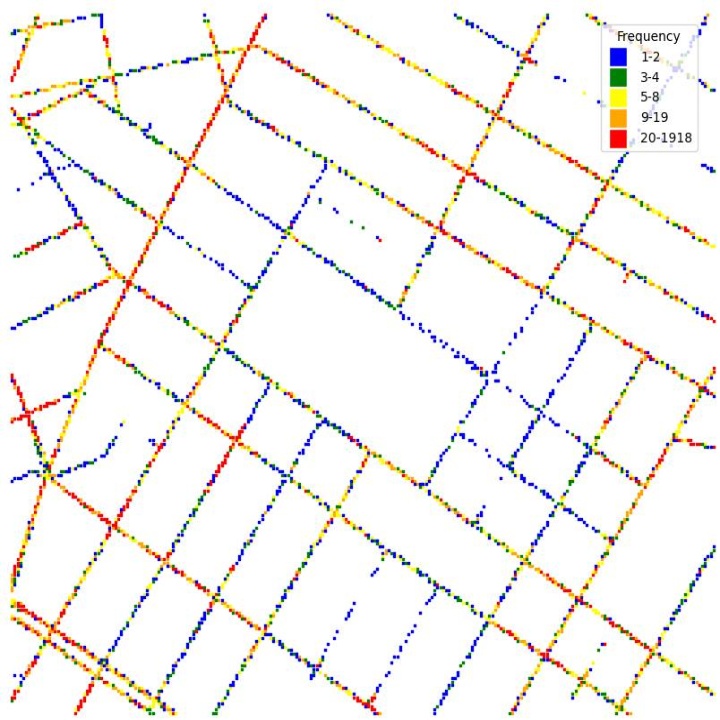
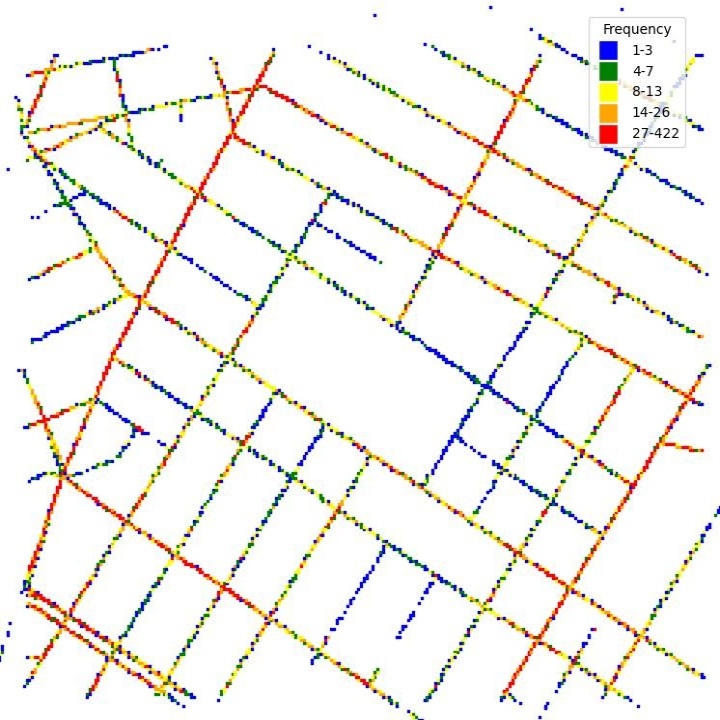
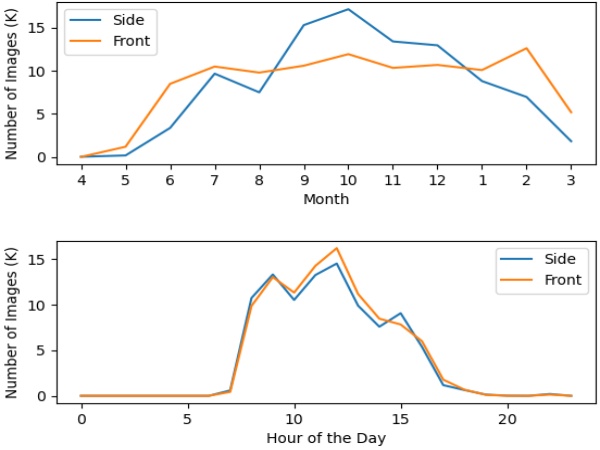
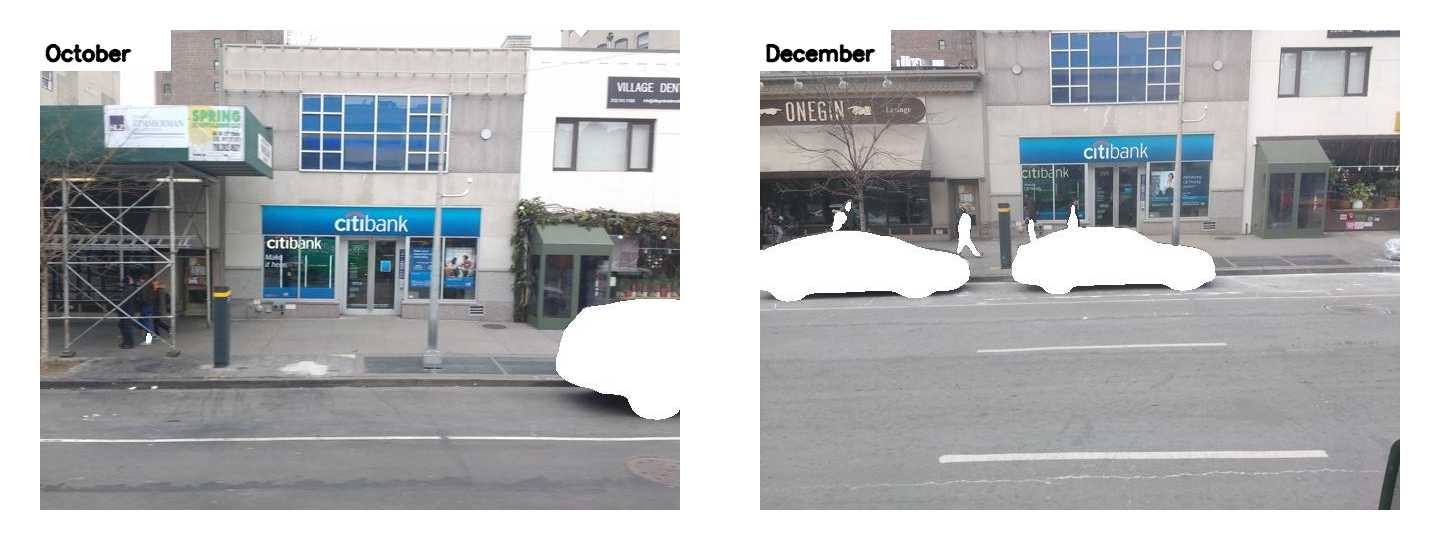
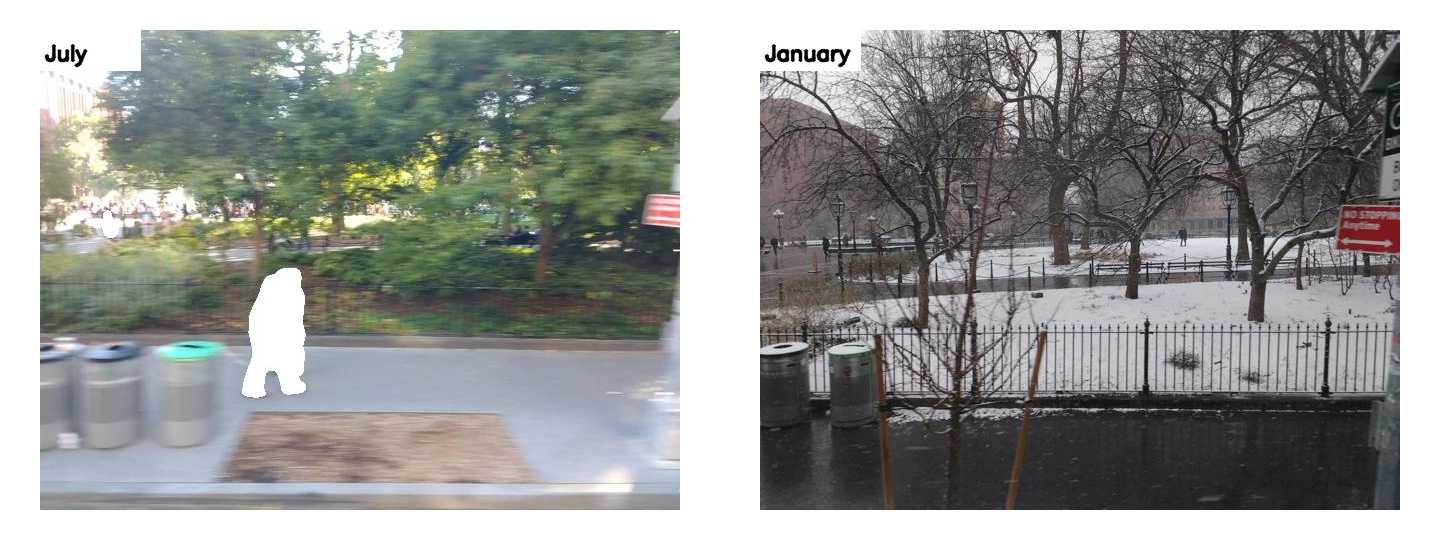
Fig. 5 shows the time distribution. Since it contains images captured from May 2016 to March 2017, our dataset includes all four seasons. Therefore, it contains various changes of weather, illumination, vegetation, and road construction. As shown in Fig. 6, we can see image changes at the same location as the season changes.

time_distribution
Fig. 5
different_time
Fig. 6

Detail Description


01

Difficulty Level

We assign each side-view query image a difficulty level of easy, medium, or hard. First, we extract SIFT features for each image. Then for each query image, we find the top-8 closest side-view training images by GPS coordinates. The query image and its top-8 closest images form eight image pairs. We use RANSAC to compute a fundamental matrix and the number of inliers for each pair of images. We use three intervals to measure the difficulty level of matching each pair based on each pair's number of inliers points: 0-19 (hard), 20-80 (medium), >80 (easy). The interval values are determined by artificially viewing the image pairs and checking the similarity of the image pairs. The difficulty level of each side-view query image is the most common difficulty level of its eight pairs.

02

Uniqueness

Our dataset is unique in two ways. First, comparing to front-view images where sky and road surfaces occupy large areas, side-view images focus on street views such as shop signs and metro entrances. Second, we include image anonymization to protect the privacy of pedestrians and cars. In the meantime, anonymized images provide VPR algorithms static and environment-only information, getting rid of moving objects and pedestrians.

03

Front-View VS Side-View

Our dataset includes images in two view directions: front-view and side-view. Front-view images has a view direction that is parallel to the driving/street direction. Front-view images usually have features of roads, shapes of skylines, and textures of the roadside buildings. Contrarily, side-view images has a view direction facing buildings along street. Side view direction is perpendicular to front view direction.

04

Other Challenges

Because our dataset is one-year long, the images taken at the same location have artificial or natural differences. First, Fig. 7 left was taken in October 2016 with sideway constructions and the right was taken in December 2016 after the construction. At some locations, the construction may cover the whole image. Second, different seasons cause different appearances at the same location. Fig. 8 left was taken in summer, July 2016, and the right was taken in winter, January 2017. In this case, the vegetation in Washington Square Park had changed a lot and snow was covering the ground in winter. Furthermore, if the vehicle was moving fast, the images taken by the vehicle will be blurry (Fig. 9). Although two images were taken at the same location, the blurry one will cause more difficulty during VPR.

construction
Fig. 7 During and After Construction
season
Fig. 8 Summer and Winter
blur
Fig. 9 Without and With Motion Blur

Download


Files are organized as four zips and a .csv file. Zip files contain images and the csv file contains information for each corresponding image such as GPS coordinates and image-taken date and time. Please fill a Google form through the following link to request dataset access.

Google Form Link: Please Click Here

Below is the Github repo of code used to perform experiments described in the paper.

Code Link: Please Click Here

Contact Us


Chen Feng - cfeng@nyu.edu

Diwei Sheng - ds5725@nyu.edu

Yuxiang Chai - yc3743@nyu.edu

Xinru Li - xl2641@nyu.edu

Acknowledgment


The raw data from Carmera was obtained from NYU VIDA lab led by Professor Claudio Silva. The project was funded by C2SMART.

vida_logo
c2smart_logo